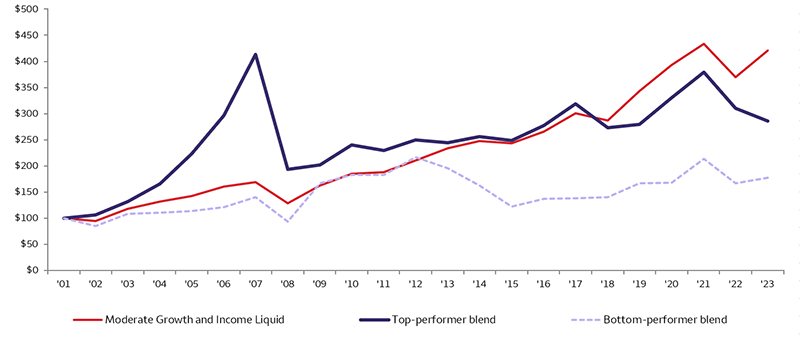
Moderate Growth and Income: 2% Bloomberg U.S. Treasury Bills (1–3 Month) Index, 30% Bloomberg U.S. Aggregate Bond Index, 6% Bloomberg U.S. Corporate High Yield Bond Index, 5% J.P. Morgan EMBI Global, 27% S&P 500 Index, 10% Russell Midcap Index, 3% Russell 2000 Index, 8% MSCI EAFE Index, 5% MSCI Emerging Markets Index, 4% Bloomberg Commodity Index.
Top-performer blend: 2002: 100% Bloomberg U.S. Aggregate Bond Index (1–3 year); 2003: 100% Bloomberg Commodity Index; 2004: 100% MSCI Emerging Markets Index; 2005: 100% MSCI Emerging Markets Index; 2006: 100% MSCI Emerging Markets Index; 2007: 100% MSCI Emerging Markets Index; 2008: 100% MSCI Emerging Markets Index; 2009: 100% J.P. Morgan GBI Global ex-U.S.; 2010: 100% MSCI Emerging Markets Index; 2011: 100% Russell 2000 Index; 2012: 100% Bloomberg U.S. Aggregate Bond Index (10+year); 2013: 100% MSCI Emerging Markets Index; 2014: 100% Russell 2000 Index; 2015: 100% Bloomberg U.S. Aggregate Bond Index (10+ year); 2016: 100% S&P 500 Index; 2017: 100% Russell 2000 Index; 2018: 100% MSCI Emerging Markets Index; 2019: 100% Bloomberg U.S. Treasury Bill 1–3 Month Index; 2020: 100% S&P 500 Index; 2021: 100% Russell 2000 Index; 2022: 100% S&P 500 Index; and 2023: 100% Bloomberg Commodity Index.
Bottom-performer blend: 2002: 100% MSCI EAFE Index; 2003: 100% S&P 500 Index; 2004: 100% Bloomberg U.S. Treasury Bill 1–3 Month Index; 2005: 100% Bloomberg U.S. Treasury Bill 1–3 Month Index; 2006: 100% J.P. Morgan GBI Global ex-U.S.; 2007: 100% Bloomberg Commodity Index; 2008: 100% Russell 2000 Index; 2009: 100% MSCI Emerging Markets Index; 2010: 100% Bloomberg U.S. Aggregate Bond Index (10+ year); 2011: 100% Bloomberg U.S. Treasury Bill 1–3 Month Index; 2012: 100% MSCI Emerging Markets Index; 2013: 100% Bloomberg Commodity Index; 2014: 100% Bloomberg Commodity Index; 2015: 100% Bloomberg Commodity Index; 2016: 100% Bloomberg Commodity Index; 2017: 100% Bloomberg U.S. Treasury Bill 1–3 Month Index; 2018: 100% Bloomberg U.S. Treasury Bill 1–3 Month Index; 2019: 100% MSCI Emerging Markets Index; 2020: 100% Bloomberg U.S. Treasury Bill 1–3 Month Index; 2021: 100% Bloomberg Commodity Index; 2022: 100% J.P. Morgan GBI Global ex-U.S.; and 2023: 100% Bloomberg U.S. Aggregate Bond Index (10+ year).
Bloomberg U.S. Aggregate Bond Index is composed of the Bloomberg U.S. Government/Credit Index and the Bloomberg U.S. Mortgage-Backed Securities Index and includes Treasury issues, agency issues, corporate bond issues, and mortgage-backed securities.
Bloomberg U.S. Corporate High Yield Bond Index covers the U.S.-dollar-denominated, non-investment-grade, fixed-rate, taxable corporate bond market. Securities are classified as high yield if the middle rating of Moody’s, Fitch, and S&P is Ba1/BB+/BB= or below. Included issues must have at least one year until final maturity.
Bloomberg U.S. Aggregate 1–3 Year Bond Index is unmanaged and is composed of the Bloomberg U.S. Government/Credit Index and the Bloomberg U.S. Mortgage-Backed Securities Index and includes Treasury issues, agency issues, corporate bond issues, and mortgage-backed securities with maturities of one to three years.
Bloomberg U.S. Aggregate 10+ Year Bond Index is unmanaged and is composed of the Bloomberg U.S. Government/Credit Index and the Bloomberg U.S. Mortgage-Backed Securities Index and includes Treasury issues, agency issues, corporate bond issues, and mortgage-backed securities with maturities of 10 years or more.
Bloomberg 1–3 Month U.S. Treasury Bill Index includes all publicly issued zero-coupon U.S. Treasury bills that have a remaining maturity of less than 3 months and more than 1 month, are rated investment grade, and have $250 million or more of outstanding face value. In addition, the securities must be denominated in U.S. dollars and must be fixed rate and non-convertible.
Bloomberg Commodity Index is a broadly diversified index of commodity futures on 20 physical commodities, subdivided into energy, U.S. agriculture, livestock, precious metals, and industrial metals sectors. Commodity weights are derived in a manner that attempts to fairly represent the importance of a diversified group of commodities to the world economy.
JP Morgan Government Bond Index Global Ex U.S. Index (JPM GBI Global Ex-U.S.) is a total return, market-capitalization-weighted index, rebalanced monthly, consisting of the following countries: Australia, Germany, Spain, Belgium, Italy, Sweden, Canada, Japan, the United Kingdom, Denmark, the Netherlands, and France.
JPM EMBI Global Index is a U.S.-dollar-denominated, investible, market-capitalization-weighted index representing a broad universe of emerging market sovereign and quasi-sovereign debt. While products in the asset class have become more diverse, focusing on both local currency and corporate issuance, there is currently no widely accepted aggregate index reflecting the broader opportunity set available, although the asset class is evolving. By using the same index provider as the one used in the developed market bonds asset class, there is consistent categorization of countries among developed international bonds (ex. U.S.) and emerging market bonds.
MSCI EAFE Index (Europe, Australasia, Far East) Index is a free-float-adjusted market-capitalization-weighted index designed to measure the equity market performance of developed markets, excluding the U.S. and Canada.
MSCI Emerging Markets Index is a free-float-adjusted market-capitalization-weighted index designed to measure equity market performance of emerging markets. Note: MSCI makes no express or implied warranties or representations and shall have no liability whatsoever with respect to any MSCI data contained herein. The MSCI data may not be further redistributed or used as a basis for other indexes or any securities or financial products. This report is not approved, reviewed, or produced by MSCI.
Russell 2000® Index measures the performance of the 2,000 smallest companies in the Russell 3000® Index, which represents approximately 8% of the total market capitalization of the Russell 3000 Index.
Russell Midcap® Index measures the performance of the 800 smallest companies in the Russell 1000® Index, which represent approximately 25% of the total market capitalization of the Russell 1000 Index.
S&P 500 Index consists of 500 stocks chosen for market size, liquidity, and industry group representation. It is a market-value-weighted index with each stock’s weight in the index proportionate to its market value.
Capital market assumptions (CMAs): It is important to note that indexes have limitations because they have volatility and other material characteristics that may differ from those of an investor's portfolio. They are unmanaged and not available for direct investment. Hedge fund indexes have limitations that are typical of other widely used market indexes, but these indexes are also subject to survivorship bias and limited data. Keep in mind that the securities included in an investment portfolio may differ significantly from the holdings, weightings, and asset allocation of an index, and unlike an index, an investment portfolio is subject to fees, expenses, taxes, transaction costs, and other charges typically associated with an investment account. The performance and volatility of an individual portfolio may be materially different from the performance of an index and should not be relied upon as a measure of the performance a portfolio may achieve. CMA forecasts are not promises of actual returns or performance that may be realized. They are based on estimates and assumptions that may not occur. There is no guarantee any investment will be profitable and not sustain a loss. Investors should consider the limitations of CMA data as it is applied to their own portfolio.
All investing involve risks, including the possible loss of principal. There can be no assurance that any investment strategy will be successful. Investments fluctuate with changes in market and economic conditions and in different environments due to numerous factors, some of which may be unpredictable. Each asset class has its own risk and return characteristics, which should be evaluated carefully before making any investment decision. The level of risk associated with a particular investment or asset class generally correlates with the level of return the investment or asset class might achieve. The risks associated with the representative asset classes discussed in this report include:
Commodities: The commodities markets are considered speculative, carry substantial risks, and have experienced periods of extreme volatility. Commodities may be affected by changes in overall market movements, commodity index volatility, changes in interest rates, or other factors affecting a particular industry or commodity.
Equity securities: Stocks are subject to market risk, which means their value may fluctuate in response to general economic and market conditions, the prospects of individual companies, and industry sectors. The prices of small/mid-company stocks are generally more volatile than large-company stocks. They often involve higher risks because smaller and midsize companies may lack the management expertise, financial resources, product diversification, and competitive strengths to endure adverse economic conditions.
Fixed income: Investments in fixed-income securities are subject to interest rate, credit/default, liquidity, inflation, and other risks. Bond prices fluctuate inversely to changes in interest rates. Therefore, a general rise in interest rates can result in a decline in the bond’s price. Credit risk is the risk that an issuer will default on payments of interest and/or principal. This risk is heightened in lower-rated bonds. If sold prior to maturity, fixed-income securities are subject to market risk. All fixed-income investments may be worth less than their original cost upon redemption or maturity. High-yield fixed-income securities are considered speculative, involve greater risk of default, and tend to be more volatile than investment-grade fixed-income securities. U.S. government securities are backed by the full faith and credit of the federal government as to payment of principal and interest if held to maturity. Although free from credit risk, they are subject to interest rate risk.
Foreign/emerging/frontier markets: Investing in foreign securities presents certain risks not associated with domestic investments, such as currency fluctuation, political and economic instability, and different accounting standards. This may result in greater share price volatility. These risks are heightened in emerging and frontier markets.
Global Investment Strategy (GIS) is a division of Wells Fargo Investment Institute, Inc. (WFII). WFII is a registered investment adviser and wholly-owned subsidiary of Wells Fargo Bank, N.A., a bank affiliate of Wells Fargo & Company.
The information in this report was prepared by Global Investment Strategy (GIS). Opinions represent GIS' opinion as of the date of this report and are for general information purposes only and are not intended to predict or guarantee the future performance of any individual security, market sector or the markets generally. GIS does not undertake to advise you of any change in its opinions or the information contained in this report. Wells Fargo & Company affiliates may issue reports or have opinions that are inconsistent with, and reach different conclusions from, this report. Past performance is no guarantee of future results.
The information contained herein constitutes general information and is not directed to, designed for, or individually tailored to, any particular investor or potential investor. This report is not intended to be a client-specific suitability or best interest analysis or recommendation, an offer to participate in any investment, or a recommendation to buy, hold or sell securities. Do not use this report as the sole basis for investment decisions. Do not select an asset class or investment product based on performance alone. Consider all relevant information, including your existing portfolio, investment objectives, risk tolerance, liquidity needs and investment time horizon. The material contained herein has been prepared from sources and data we believe to be reliable but we make no guarantee to its accuracy or completeness.
Wells Fargo Advisors is registered with the U.S. Securities and Exchange Commission and the Financial Industry Regulatory Authority, but is not licensed or registered with any financial services regulatory authority outside of the U.S. Non-U.S. residents who maintain U.S.-based financial services account(s) with Wells Fargo Advisors may not be afforded certain protections conferred by legislation and regulations in their country of residence in respect of any investments, investment transactions or communications made with Wells Fargo Advisors.
Wells Fargo Advisors is a trade name used by Wells Fargo Clearing Services, LLC and Wells Fargo Advisors Financial Network, LLC, Members SIPC, separate registered broker-dealers and non-bank affiliates of Wells Fargo & Company.
©2024 Wells Fargo Investment Institute. All rights reserved.


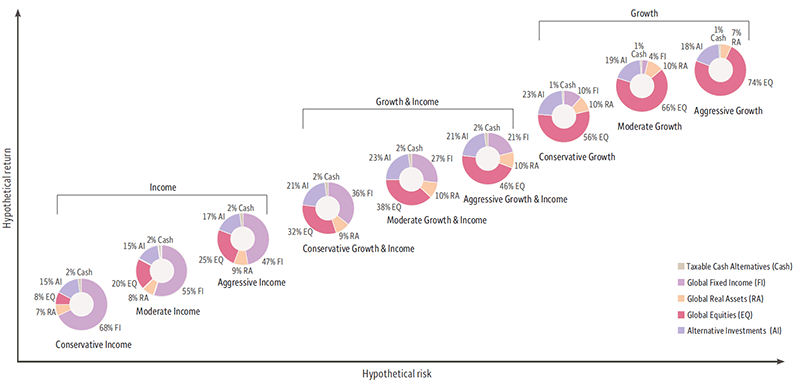
 Source: Wells Fargo Investment Institute, as of July 16, 2024. Chart is conceptual and does not reflect any actual returns or represent any specific asset classifications. Past performance is no guarantee of future results.
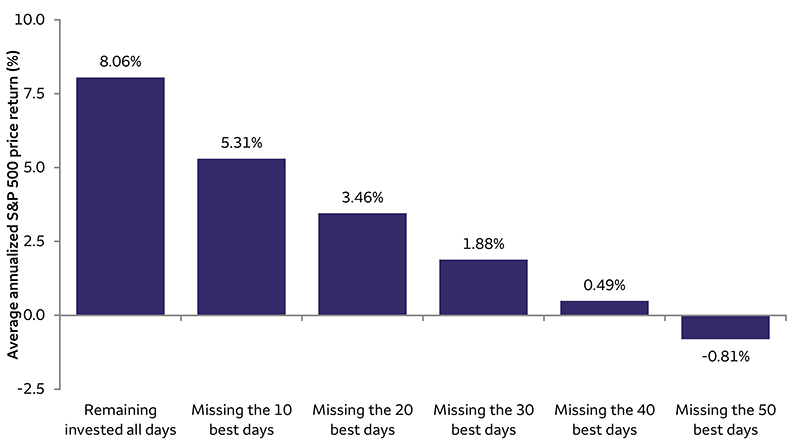
 Sources: Bloomberg and Wells Fargo Investment Institute. Data from January 1, 1994, to December 31, 2023. For illustrative purposes only. The fact that buy and hold has been a successful strategy in the past does not guarantee that it will continue to be successful in the future. The performance shown is not indicative of any particular investment. An index is unmanaged and not available for direct investment. A price index is not a total return index and does not include the reinvestment of dividends. Past performance is not a guarantee of future results. See end of report for risks and index definitions. Best days are defined as the days with the highest single daily returns for the S&P 500 Index.
 Sources: © Morningstar Direct, All Rights Reserved,* and Wells Fargo Investment Institute. Data from December 31, 2001, to December 31, 2023. Indexed to 100 as of December 31, 2001. The top-performer blend allocates 100% in the current year to the top performing asset class of the previous year. The bottom-performer blend allocates 100% in the current year to the bottom performing asset class of the previous year. Performance results for Moderate Growth and Income Liquid and the top and bottom performer blends are calculated using blended index returns. Moderate Growth & Income allocation is dynamic, and changes as needed with adjustments to the strategic allocations. Index return information is provided for illustrative purposes only. Index returns do not represent investment performance or the results of actual trading. Index returns represent general market results, assume the reinvestment of dividends and other distributions and do not reflect deduction for fees, expenses or taxes applicable to an actual investment. Past performance is no guarantee of future results. See end of report for blended index compositions, risks and index definitions.