


Uncertainty is an inherent part of investing. An investor’s key to success largely depends on how they respond to it. We recommend four steps for investors to prepare for what could be ahead:
1
Start with a plan
2
Construct a portfolio
3
Globalize the portfolio
4
Maintain alignment to the plan

We believe the plan should be durable enough for the long term, yet stable enough to dissuade investors from abandoning it out of fear when times get tough. And while the plan should be flexible enough to accommodate major life changes, it should stay focused on the investor’s goals.
Determine financial goals
In developing a plan, an investor begins by identifying their financial goals. Each of these goals should be matched to a time when they will need the funds to accomplish the goal. Some will be near-term goals, like establishing a “rainy day fund” to help cover day-to-day bills should they experience an interruption in income. Others may be intermediate-term goals, such as paying for a child’s college tuition or buying a new or vacation home. Still others may be longer-term goals, like helping finance retirement or perhaps making a bequest for future generations or charitable organizations.
Build a rainy day fund for unexpected expenses
Starting with shorter-term goals means identifying how much liquidity, or readily accessible funds, an investor may need to cover day-to-day expenses should they experience an interruption in regular income or a significant unexpected expense.
We believe investors should set aside an amount of cash necessary to remain committed to their long-term investment plan. Some investors might consider one or two years’ worth of living expenses as a reasonable amount. For others, six to nine months’ worth of living expenses may be sufficient. Like the investment plan, the appropriate level of reserves is unique for each investor.
Select investments appropriate for the goal
With cash reserves set aside for emergencies, an investor can focus on intermediate- and longer-term goals. Keeping in mind the goals their investment plan is targeted to accomplish can help them decide which types of assets are appropriate for funding each of their goals.
For example, if one is saving for college tuition for a newborn child, then stocks may be an appropriate choice. If stock prices should plunge in value, as they did in early 2022, many years remain for the market to potentially recover before the child will need the funds. And by investing in stocks regularly over time, an investor could be purchasing more shares at lower prices. On the other hand, savings for a home down payment in two years may be better left in cash or short-term fixed income.
Prepare for changing circumstances
An important consideration when choosing an appropriate mix of assets is risk tolerance. Determining how comfortable an investor is to look beyond short-term market dips and ride out bad times without abandoning their long-term strategy can also assist in determining risk tolerance.
Keep emotions in check
Human emotions, especially fear and greed, play an important role in investor behavior. Unfortunately, these emotions often do not lead to prudent investment decision-making and often tempt investors to attempt to time the markets.
Consider Dalbar’s annual study that calculates the returns for average equity mutual fund investors and compares them with equity market index returns. Interestingly, it turns out the average retail investor fares much worse than the S&P 500 Index (see chart below). Dalbar attributes this result mainly to performance-chasing behavior, in which investors allocate more funding to assets that have done well recently and ignore those that have done poorly. They call this tendency the “investor behavior penalty.”
Attempting to time the market has proven costly
Investor returns have substantially lagged the markets, 1994-2023. 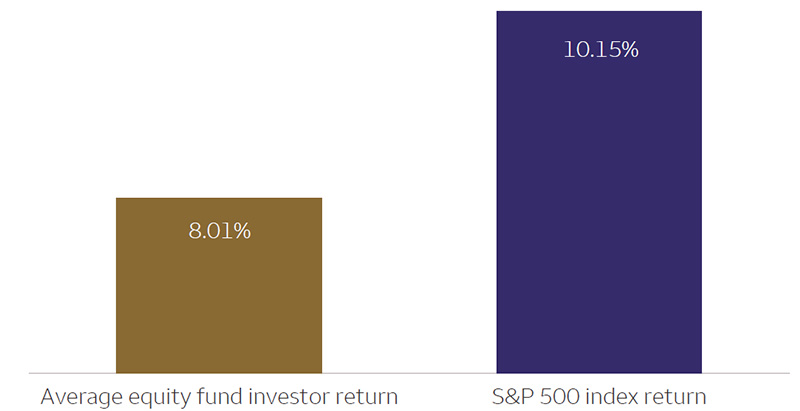 Source: Dalbar, 30 years from 1994 – 2023. “Quantitative Analysis of Investor Behavior,” 2024, DALBAR, Inc., www.dalbar.com. Average annual return; for illustrative purposes only. Dalbar computed the average stock fund investor return by using industry cash flow reports from the Investment Company Institute. The Average Equity Fund Investor is comprised of a universe of both domestic and world equity mutual funds. It includes growth, sector, alternative strategy, value, blend, emerging markets, global equity, international equity, and regional equity funds. The S&P 500 Index is a market-capitalization-weighted index composed of 500 stocks generally considered representative of the U.S. stock market. The fact that buy and hold has been a successful strategy in the past does not guarantee that it will continue to be successful in the future. The performance shown is not indicative of any particular investment. An index is unmanaged and not available for direct investment. Total returns assume reinvestment of dividends and capital gain distributions. Past performance is not a guarantee of future results.
Source: Dalbar, 30 years from 1994 – 2023. “Quantitative Analysis of Investor Behavior,” 2024, DALBAR, Inc., www.dalbar.com. Average annual return; for illustrative purposes only. Dalbar computed the average stock fund investor return by using industry cash flow reports from the Investment Company Institute. The Average Equity Fund Investor is comprised of a universe of both domestic and world equity mutual funds. It includes growth, sector, alternative strategy, value, blend, emerging markets, global equity, international equity, and regional equity funds. The S&P 500 Index is a market-capitalization-weighted index composed of 500 stocks generally considered representative of the U.S. stock market. The fact that buy and hold has been a successful strategy in the past does not guarantee that it will continue to be successful in the future. The performance shown is not indicative of any particular investment. An index is unmanaged and not available for direct investment. Total returns assume reinvestment of dividends and capital gain distributions. Past performance is not a guarantee of future results.
Each of an investor’s financial goals has different attributes: priority; time horizon; and the need for liquidity, income, or growth. As a result, each goal has a unique investment objective — and a distinct combination of assets that is most likely to help achieve the goal. Establishing this combination (or strategic allocation) is one of the most important investment decisions.
Asset allocation can be the most important investment decision
Studies (including our own) have shown asset allocation is often a crucial determinant of portfolio performance. The other factors shown in the chart below have historically had less impact on the variability of returns over time. While tactical asset allocation has a six- to 18-month time horizon, strategic asset allocation has a much longer horizon covering multiple market cycles. Strategic allocation, therefore, deserves considerable focus and effort.
Variability of returns by source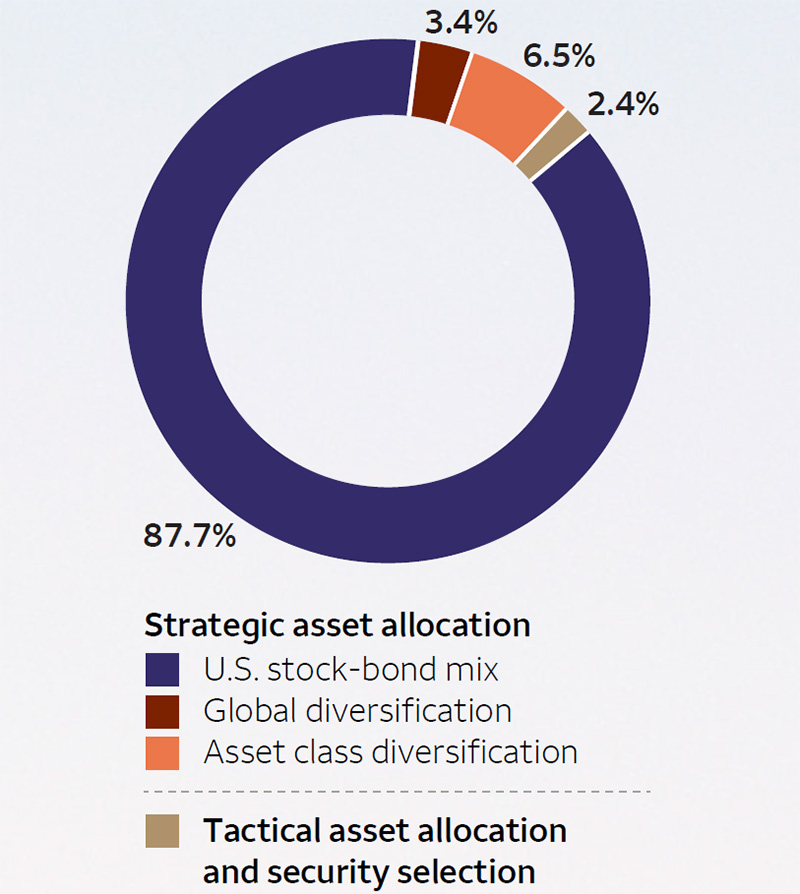 Note: Strategic asset allocation comprises US stock-bond mix, global diversification, and asset class diversification. Sources: Wells Fargo Investment Institute, Bloomberg, and Morningstar Direct, 2024. Portfolio is the averages of the U.S. Moderate Income, U.S. Moderate Growth and Income, and Moderate Growth allocations: Please see dropdown titled Index definitions for definitions of allocations. An index is not managed and not available for direct investment. Past performance is not a guarantee of future results.
Tactical asset allocation: Making of short-term adjustments to asset-class weights based on shorter-term expected relative performance.
Strategic asset allocation: An investor’s return objectives, risk tolerances, and investment constraints are integrated with long-term return assumptions to establish exposure to permissible asset classes. In our study, strategic asset allocation comprises U.S. stock bond mix, global diversification (asset groups), and asset class diversification.
Asset allocation, including strategic and tactical asset allocation, does not guarantee investment returns or eliminate the risk of loss.
Note: Strategic asset allocation comprises US stock-bond mix, global diversification, and asset class diversification. Sources: Wells Fargo Investment Institute, Bloomberg, and Morningstar Direct, 2024. Portfolio is the averages of the U.S. Moderate Income, U.S. Moderate Growth and Income, and Moderate Growth allocations: Please see dropdown titled Index definitions for definitions of allocations. An index is not managed and not available for direct investment. Past performance is not a guarantee of future results.
Tactical asset allocation: Making of short-term adjustments to asset-class weights based on shorter-term expected relative performance.
Strategic asset allocation: An investor’s return objectives, risk tolerances, and investment constraints are integrated with long-term return assumptions to establish exposure to permissible asset classes. In our study, strategic asset allocation comprises U.S. stock bond mix, global diversification (asset groups), and asset class diversification.
Asset allocation, including strategic and tactical asset allocation, does not guarantee investment returns or eliminate the risk of loss.

Although many investors gravitate toward easily recognizable U.S. companies, building a globally diversified portfolio means adding appropriate levels of international assets. Many large, internationally based companies have become household names in the U.S. And historically, international stocks have benefited from a strengthening U.S. and global economy. We encourage investors to focus on the long-term positive outlook for global economic growth.
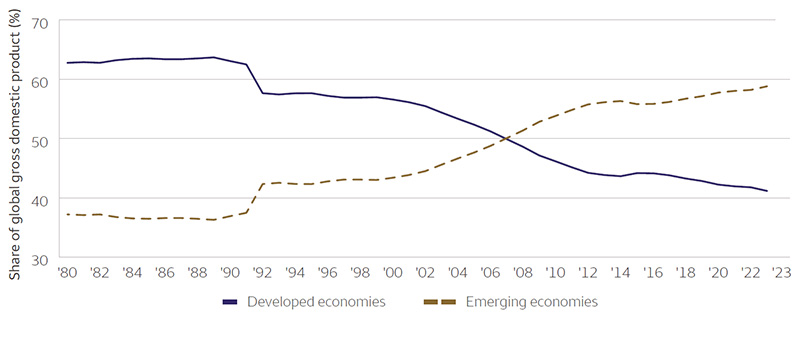
Emerging markets offer growth potential
Some exposure to faster-growing emerging markets can add another layer of diversification to a portfolio. As illustrated in the following chart, emerging markets contribute more to global economic growth than developed markets.
Emerging economies have overtaken developed economies
The percentage of global GDP contributed by emerging economies eclipsed that from developed economies several years ago.
 Sources: International Monetary Fund (IMF) and Wells Fargo Investment Institute, as of December 31, 2023. Developed economies and emerging economies based on IMF World Economic Outlook country classification. GDP=gross domestic product. The percentage of GDP data is based on PPP (purchasing power parity) numbers. Purchasing power parity is a currency conversion rate that equalizes the purchasing power of different currencies. It’s a way to compare the price levels of goods and services across countries.
A change in economic conditions or large market moves, upward or downward, can significantly alter a portfolio’s risk/reward profile. Failing to rebalance during a bull market can lead to overexposure to equities, drastically changing the risk profile of the intended allocation and potentially leaving the portfolio vulnerable if or when a bear market starts. Allowing the portfolio to drift during a bear market can likely result in a higher allocation to fixed income than intended as portfolio allocations drift from strategic targets and an investor’s desired risk level. This could impact the time it takes for a portfolio to recover once the bear market is over.
Rebalancing can help manage risk
A constructive way to realign a portfolio is to periodically trim those asset classes that have grown beyond target levels and invest in those that have dropped below target levels to bring the allocation back to its original targets. This is an effective version of the “buy low, sell high” principle. But it is important to recognize that rebalancing a portfolio may trigger capital gains taxes, so tax-sensitive investors need to take this factor into consideration. A more subtle way of rebalancing is to direct any new funds into asset classes that are underweighted and to fund any cash needs by selling asset classes that are overweighted.
Stay the course
While it is important to design a solid plan and then implement it using a mix of assets and proper diversification, these efforts may be all for naught if an investor is unable to adhere to the plan. We believe market volatility should be viewed as a potential opportunity rather than an obstacle for investors. Expectations for more normal volatility levels, with periodic spikes given today’s economic and geopolitical uncertainties, may offer greater rewards to patient and disciplined investors.
Periodically reevaluate your investment strategy
There are legitimate reasons to change an investment plan. Milestones such as getting married, buying a home, starting a family, supporting a child through college, and retirement are just a few examples of significant life changes. As major life events approach, this offers an opportune time to reevaluate investment goals and determine whether any changes to the overall investment strategy are warranted.
Material changes in net worth also provide grounds to reevaluate the investment asset mix. A market downturn and subsequent rebound may put some investors’ portfolios out of sync due to selling assets too early and/or waiting to rebalance. These “opportunity” losses could increase the need for portfolio growth and may even require more risk-taking in the portfolio.
Turning points that can affect an investment plan for individuals in their:
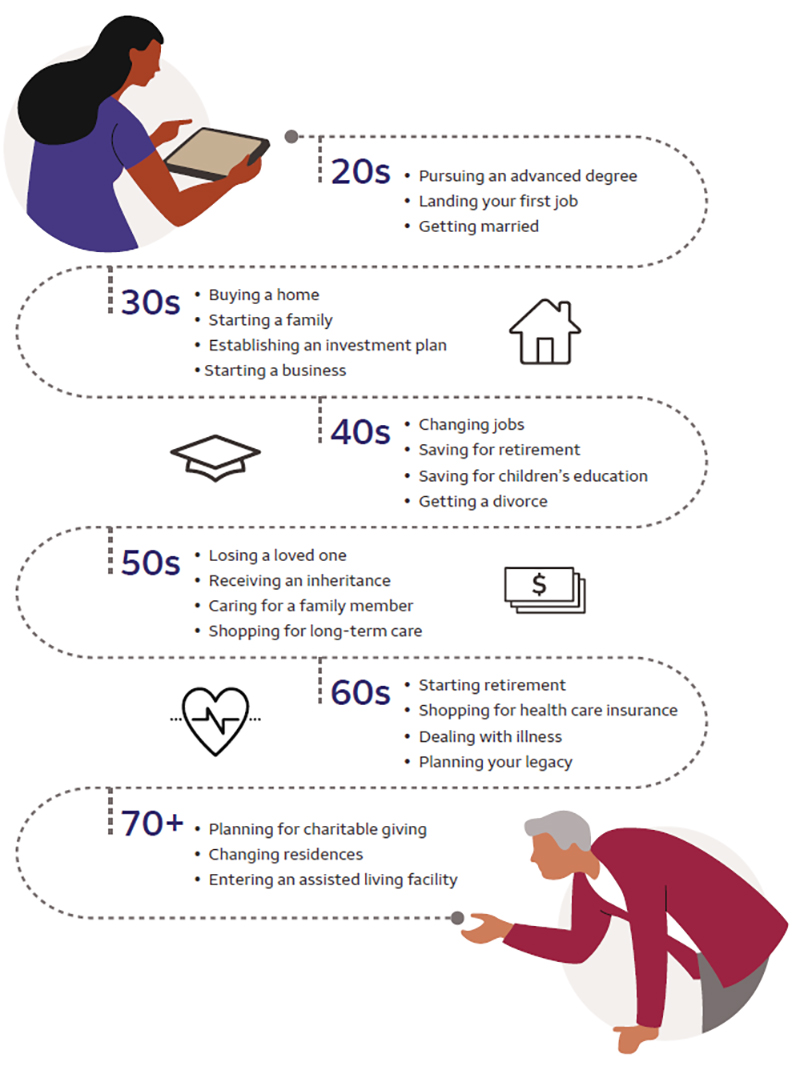 Examples are for illustrative purposes only and may not reflect an individual’s own experience.
Source: Wells Fargo Investment Institute
Rebalance to manage risk
A well-constructed investment plan based on an investor’s unique circumstances that is rebalanced regularly can help alleviate anxiety over market uncertainty. This can be especially helpful during periods of heightened volatility that we expect from time to time in normally functioning markets.
Some investors hesitate to invest after a significant increase in stock prices or wait until the markets are “normal.” Our research has shown that attempts at market timing have often been costly. Instead, we recommend periodic rebalancing as it can enhance investment performance even when the market is up by maintaining the portfolio’s desired risk profile.
Keep plan aligned with investment goals
We recommend working together with an investment professional to develop an investment plan. If a plan is already in place, we suggest checking with an investment advisor to ensure the plan reflects current financial circumstances and goals. Once goals are identified and reviewed for reasonableness, they should serve as the basis for a well-constructed, long-term strategy.
Asset allocation cannot eliminate the risk of fluctuating prices and uncertain returns. Diversification cannot eliminate the risk of fluctuating prices and uncertain returns.
Equity investments: Stocks offer long-term growth potential but may fluctuate more and provide less current income than other investments. An investment in the stock market should be made with an understanding of the risks associated with common stocks, including market fluctuations.
Fixed income: Investments in fixed-income securities are subject to interest rate, credit/default, liquidity, inflation, prepayment, extension, and other risks. Bond prices fluctuate inversely to changes in interest rates. Therefore, a general rise in interest rates can result in a decline in the bond’s price. Credit risk is the risk that an issuer will default on payments of interest and/or principal. High-yield fixed-income securities (junk bonds) are considered speculative, involve greater risk of default, and tend to be more volatile than investment-grade fixed-income securities. If sold prior to maturity, fixed-income securities are subject to market risk. All fixed-income investments may be worth less than their original cost upon redemption or maturity.
Foreign investments: Investing in foreign securities presents certain risks not associated with domestic investments, such as currency fluctuation, political and economic instability, and different accounting standards. This may result in greater share price volatility. These risks are heightened in emerging markets.
An index is unmanaged and unavailable for direct investment.
Bloomberg U.S. Aggregate Bond Index is a broad-based measure of the investment-grade, U.S.-dollar-denominated, fixed-rate taxable bond market.
Bloomberg U.S. Corporate High-Yield Bond Index covers the universe of fixed-rate, non-investment-grade debt.
Bloomberg U.S. Treasury Bill (1–3 Month) Index is representative of money markets.
Bloomberg Commodity Index is a broadly diversified index comprised of exchange-traded futures on physical commodities weighted to account for economic significance and market liquidity.
JPM EMBI Global Index is a U.S.-dollar-denominated, investible, market-cap-weighted index representing a broad universe of emerging market sovereign and quasi-sovereign debt. While products in the asset class have become more diverse, focusing on both local currency and corporate issuance, there is currently no widely accepted aggregate index reflecting the broader opportunity set available, although the asset class is evolving. By using the same index provider as the one used in the developed market bonds asset class, there is consistent categorization of countries among developed international bonds (ex. U.S.) and emerging market bonds.
Moderate Growth is composed of: 2% Bloomberg U.S. Treasury Bills (1–3 Month) Index, 8% Bloomberg U.S. Aggregate Bond Index, 3% Bloomberg U.S. Corporate High Yield Bond Index, 35% S&P 500 Index, 14% Russell Midcap Index, 6% Russell 2000 Index, 15% MSCI EAFE Index, 12% MSCI Emerging Markets Index, 5% Bloomberg Commodity Index.
Moderate Growth & Income is composed of: 2% Bloomberg U.S. Treasury Bills (1–3 Month) Index, 30% Bloomberg U.S. Aggregate Bond Index, 6% Bloomberg U.S. Corporate High Yield Bond Index, 5% JPM EMBI Global Index, 27% S&P 500 Index, 10% Russell Midcap Index, 3% Russell 2000 Index, 8% MSCI EAFE Index, 5% MSCI Emerging Markets Index, 4% Bloomberg Commodity Index.
Moderate Income is composed of: 2% Bloomberg U.S. Treasury Bills (1–3 Month) Index, 60% Bloomberg U.S. Aggregate Bond Index, 4% Bloomberg U.S. Corporate High Yield Bond Index, 5% JPM EMBI Global Index, 18% S&P 500 Index, 5% Russell Midcap Index, 4% MSCI EAFE Index, 2% Bloomberg Commodity Index.MSCI EAFE Index is designed to represent the performance of large- and mid-cap securities across 21 developed markets, including countries in Europe, Australasia, and the Far East, excluding the U.S. and Canada.
MSCI Emerging Markets Index is a free-float-adjusted market-capitalization-weighted index designed to measure equity market performance of 24 emerging market countries.
MSCI makes no express or implied warranties or representations and shall have no liability whatsoever with respect to any MSCI data contained herein. The MSCI data may not be further redistributed or used as a basis for other indexes or any securities or financial products. This report is not approved, reviewed, or produced by MSCI.
Russell 1000® Index measures the performance of the 1,000 largest companies in the Russell 3000 Index, which represents approximately 90% of the total market capitalization of the Russell 3000 Index.
Russell 2000® Index measures the performance of the 2,000 smallest companies in the Russell 3000 Index, which represents approximately 8% of the total market capitalization of the Russell 3000 Index.
Russell 3000® Index measures the performance of the 3,000 largest U.S. companies based on total market capitalization, which represents approximately 98% of the investable U.S. equity market.
Russell Midcap® Index measures the performance of the 800 smallest companies in the Russell 1000 Index, which represent approximately 25% of the total market capitalization of the Russell 1000 Index.
S&P 500 Index consists of 500 stocks chosen for market size, liquidity, and industry group representation. It is a market-value-weighted index with each stock’s weight in the index proportionate to its market value.
Global Investment Strategy (GIS) is a division of Wells Fargo Investment Institute, Inc. (WFII). WFII is a registered investment adviser and wholly owned subsidiary of Wells Fargo Bank, N.A., a bank affiliate of Wells Fargo & Company.
The information in this report was prepared by the Global Investment Strategy (GIS) division of WFII. Opinions represent GIS’ opinion as of the date of this report and are for general informational purposes only and are not intended to predict or guarantee the future performance of any individual security, market sector, or the markets generally. GIS does not undertake to advise you of any change in its opinions or the information contained in this report. Wells Fargo & Company affiliates may issue reports or have opinions that are inconsistent with, and reach different conclusions from, this report.
The information contained herein constitutes general information and is not directed to, designed for, or individually tailored to any particular investor or potential investor. This report is not intended to be a client-specific suitability or best interest analysis or recommendation, an offer to participate in any investment, or a recommendation to buy, hold, or sell securities. Do not use this report as the sole basis for investment decisions. Do not select an asset class or investment product based on performance alone. Consider all relevant information, including your existing portfolio, investment objectives, risk tolerance, liquidity needs, and investment time horizon.
Wells Fargo Advisors is registered with the U.S. Securities and Exchange Commission and the Financial Industry Regulatory Authority but is not licensed or registered with any financial services regulatory authority outside of the U.S. Non-U.S. residents who maintain U.S.-based financial services account(s) with Wells Fargo Advisors may not be afforded certain protections conferred by legislation and regulations in their country of residence in respect of any investments, investment transactions, or communications made with Wells Fargo Advisors.
Wells Fargo Advisors is a trade name used by Wells Fargo Clearing Services, LLC, and Wells Fargo Advisors Financial Network, LLC, Members SIPC, separate registered broker-dealers and nonbank affiliates of Wells Fargo & Company.