April 15, 2025
Global Asset Allocation Strategy Team
Longer-term perspective on market volatility
 Sources: Bloomberg and Wells Fargo Investment Institute. Daily data: April 10, 1995, through April 9, 2025, for the S&P 500 Index. Best and worst days are calculated using daily returns. For illustrative purposes only. A price index is not a total return index and does not include the reinvestment of dividends. There are difficulties assessing index performance during certain correction periods, in part, because index results do not represent actual trading and cannot completely account for the impact financial risk has on actual trading. An index is unmanaged and not available for direct investment. Past performance is no guarantee of future results. Excerpted from Special Report: The perils of trying to time volatile markets
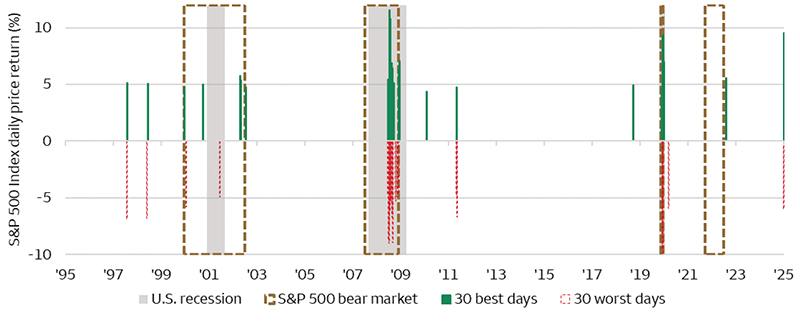
The best days and worst days in the market have often occurred close together
Amid a flurry of tariff-related headlines, the S&P 500 Index fell a cumulative 12.1% during the four trading days between April 3 and April 8 before spiking 9.5% in one day, on April 9. Recent events have investors questioning how low the market may go as ongoing uncertainty has driven dramatic swings. However, historical data suggests that such swings — both positive and negative — are not uncommon during periods of volatility.
Our analysis shows that the best and worst days have often occurred close together, and often when markets were most volatile (see chart). Over the past 30 years, three of the 30 best days and five of the 30 worst days occurred during the eight trading days between March 9 and March 18, 2020.
What it may mean for investors
Disentangling the best and worst days can be quite difficult, history suggests, since they have often occurred in a very tight time frame, sometimes even on consecutive trading days. In our view, these findings argue strongly for most investors to remain invested in equity markets, even during periods of high volatility.
Risk Considerations
Each asset class has its own risk and return characteristics. The level of risk associated with a particular investment or asset class generally correlates with the level of return the investment or asset class might achieve. Stock markets are volatile. Stock values may fluctuate in response to general economic and market conditions, the prospects of individual companies, and industry sectors.
General Disclosures
Global Investment Strategy (GIS) is a division of Wells Fargo Investment Institute, Inc. (WFII). WFII is a registered investment adviser and wholly owned subsidiary of Wells Fargo Bank, N.A., a bank affiliate of Wells Fargo & Company.
The information in this report was prepared by Global Investment Strategy. Opinions represent GIS’ opinion as of the date of this report and are for general information purposes only and are not intended to predict or guarantee the future performance of any individual security, market sector or the markets generally. GIS does not undertake to advise you of any change in its opinions or the information contained in this report. Wells Fargo & Company affiliates may issue reports or have opinions that are inconsistent with, and reach different conclusions from, this report.
The information contained herein constitutes general information and is not directed to, designed for, or individually tailored to, any particular investor or potential investor. This report is not intended to be a client-specific suitability or best interest analysis or recommendation, an offer to participate in any investment, or a recommendation to buy, hold or sell securities. Do not use this report as the sole basis for investment decisions. Do not select an asset class or investment product based on performance alone. Consider all relevant information, including your existing portfolio, investment objectives, risk tolerance, liquidity needs and investment time horizon. The material contained herein has been prepared from sources and data we believe to be reliable but we make no guarantee to its accuracy or completeness.
Wells Fargo Advisors is registered with the U.S. Securities and Exchange Commission and the Financial Industry Regulatory Authority, but is not licensed or registered with any financial services regulatory authority outside of the U.S. Non-U.S. residents who maintain U.S.-based financial services account(s) with Wells Fargo Advisors may not be afforded certain protections conferred by legislation and regulations in their country of residence in respect of any investments, investment transactions or communications made with Wells Fargo Advisors.
Wells Fargo Advisors is a trade name used by Wells Fargo Clearing Services, LLC and Wells Fargo Advisors Financial Network, LLC, Members SIPC, separate registered broker-dealers and non-bank affiliates of Wells Fargo & Company.


