Natural gas — Growing demand, supply, and volatility
As we have written in the past, we believe that multiple secular factors are converging to drive increased structural demand for natural gas over the next several years. We expect this to result in higher natural gas prices on average, but also higher volatility as supply growth coincides with rising demand.
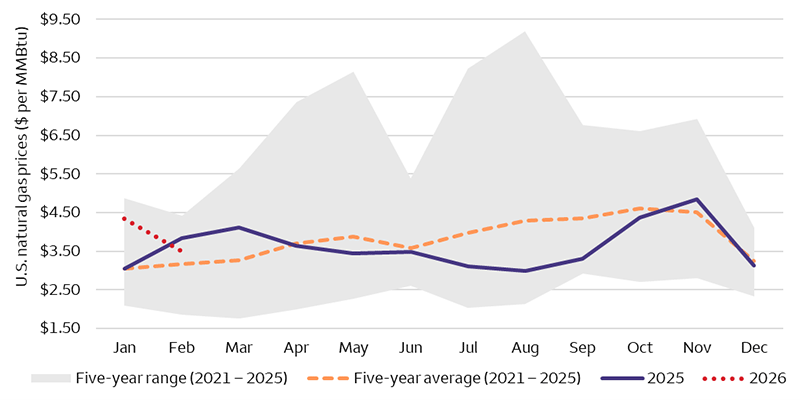
While we have strong conviction in the direction of natural gas demand growth, the timing and magnitude of this growth is increasingly being debated by investors. There are a number of nuanced variables in play, and current forecasts vary widely based on differing assumptions. Recent spikes in natural gas prices have generated headlines at times, but this has been driven by weather trends and typical seasonality. As shown in Chart 1 below, natural gas prices have remained generally in line with historical levels.
Chart 1. Recent natural gas prices have been in line with historical levels
Sources: FactSet and Wells Fargo Investment Institute. MMBtu = million British thermal units. U.S. natural gas prices represented by Henry Hub benchmark.
We see growth in U.S. liquefied natural gas (LNG) exports as the most pertinent near-term driver of higher natural gas demand. Exports have increased steadily over the past several years, and domestic LNG export capacity is set to grow by another 86% through the end of this decade based on projects that are under construction or fully sanctioned. However, there are some concerns of a potential global LNG supply glut emerging in conjunction with upcoming capacity additions from other countries. If this is the case, some U.S. LNG facilities may operate at a reduced capacity, which could have significant implications for natural gas demand.
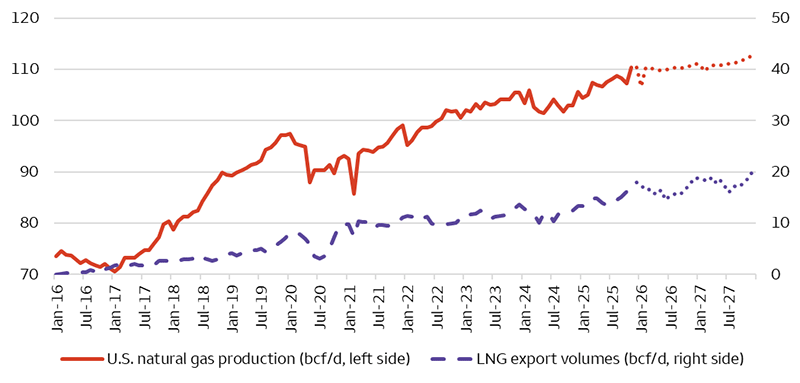
Chart 2. Natural gas supply growth has coincided with increasing LNG exports
Sources: Energy Information Administration (EIA) and Wells Fargo Investment Institute. Bcf/d = billion cubic feet per day. Dotted lines represent EIA forecast data as of February 10, 2026.
As shown in Chart 2 above, U.S. natural gas production has expanded alongside rising LNG exports. We expect new LNG facilities to remain well supplied as additional capacity comes online. Two key areas for supply growth will be the Haynesville and Permian Basins. The Haynesville Basin will play a key role in meeting future demand given its reserves, scalable production, and proximity to Gulf Coast LNG terminals, though its relatively high production costs make its volumes more sensitive to price. Meanwhile, the Permian Basin is becoming an increasingly important source of low cost supply. Multiple new pipelines and expansions are set to increase Permian gas takeaway capacity by over 50% by 2030, which will connect existing production with improved access to highdemand markets.
Growing power demand is another important source of natural gas demand growth, largely driven by power needs of data centers as well as growth in industrial manufacturing and coal-to-gas switching. While we believe that an all-of-the-above approach is required to meet the nation’s growing power needs, challenges facing renewable and nuclear energy sources are placing a higher emphasis on natural gas for power generation, while affordability concerns are also pushing data-center developers to partner directly with utility companies for bespoke solutions.
The evolving relationship between natural gas demand and supply growth may be uneven at times, and we expect periods of imbalances in the market to drive price volatility. We expect higher natural gas prices on average over the coming years but also note that periods of elevated volatility may offset some of the benefits of higher prices for producers. We continue to view infrastructure as the key enabler in balancing the market over time, underscoring our favorable view on the Midstream Energy sub-sector.
Understanding income risk in Financials
As policy rates drift lower, differences in how Financials generate income are becoming more apparent, underscoring the need to evaluate dividend stability across sub-sectors.
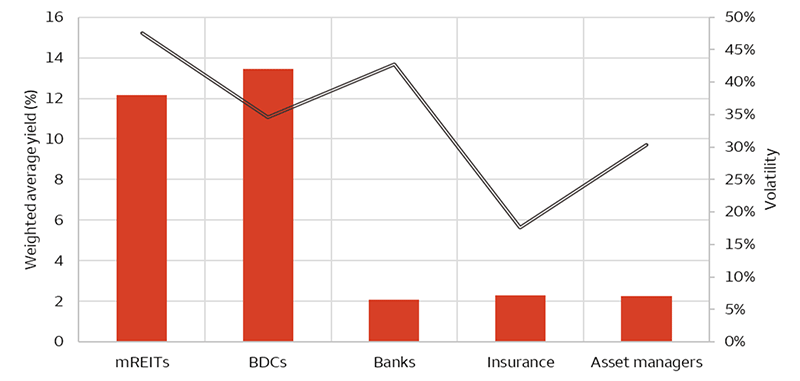
Income profiles across public Financials behave very differently in a declining-rate environment. For banks, dividends are supported by core deposit franchises and conservative balance sheets that tend to be more resilient even as net interest margins compress. Business development corporations (BDCs) face a more rate-sensitive dynamic. Their predominately floating-rate portfolios have benefited from elevated base rates, leaving them vulnerable to lower portfolio yields as the Fed cuts rates further. In this environment, dividend durability will depend on credit selection, leverage discipline, and fee income rather than rate levels alone.
Mortgage REITs encounter a more mixed backdrop. Lower rates typically support book values, but income generation remains largely tied to leverage and spread management. Historically, yield in the mortgage REIT industry has compensated investors for volatility rather than delivered stable total return.
By contrast, asset managers and insurance companies experience relatively less earnings pressure from rate movements, in our view. Asset managers benefit from recurring management fee revenue and robust free cash flow (amount of cash left over after expenses), while insurers support dividends through underwriting profitability and excess capital. These industries offer comparatively stable income profiles through a Fed easing cycle.
We believe income stability will vary widely across the Financials sector as the rate cycle turns and understanding where dividends are supported by fundamentals rather than interest-rate levels alone will be important.
Chart 3. Yield versus volatility by Financials sub-sectors
Sources: FactSet and Wells Fargo Investment Institute. Weighted average yield data from 2009 through 2025. Volatility refers to the variability of dividend yield over time, which services as a proxy for income stability.
Past performance is no guarantee of future results. An index is unmanaged and not available for direct investment.
Will the Fed’s balance-sheet strategy change soon?
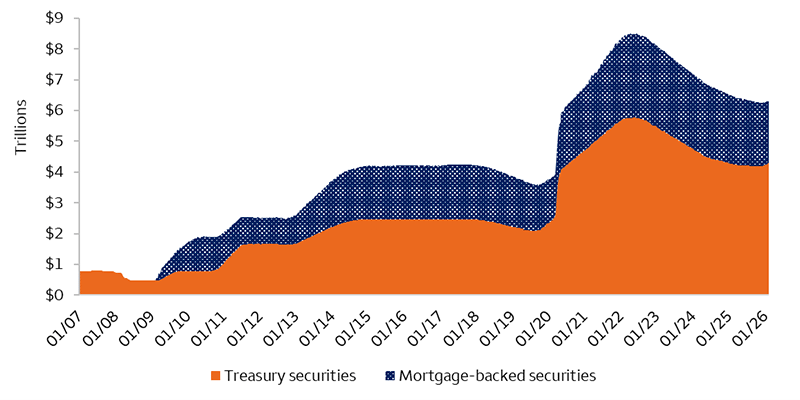
Last October, the Fed announced a pivot to its balance-sheet operations, moving from quantitative tightening (i.e., balance-sheet reduction) back to a lite version of purchases. On December 1, 2025, the Fed started reinvesting all of its maturing holdings (including Treasuries, agency debt, and agency mortgage-backed securities) back into Treasury bills and other Treasury securities with remaining maturities of three years or less to maintain an ample level of reserves.
Then, Kevin Warsh was nominated as Fed governor and chair on January 30, and the discussion around the Fed’s balance-sheet strategy began to intensify. Warsh has been a persistent critic of the Fed’s asset expansion following the global financial crisis, arguing that the central bank’s balance sheet has become excessively large. In Warsh’s view, the problem is that the Fed accumulates assets, raising its balance sheet, but pays for these additional assets with cash that goes into the economy and the financial markets. That extra cash can distort financial conditions by making it too easy to borrow. Warsh argues that a smaller balance sheet would avoid this distortion and thereby require fewer changes in interest rate policy.
If the Fed eventually begins to step back from reinvesting in Treasuries, we believe this would be another factor that may cause longer-term Treasury yields to rise. The impact would be further widening of the spread between long and short-term Treasury yields, especially if investors demand higher compensation for reduced Fed support.
Chart 4. The Fed’s balance sheet
Sources: Bloomberg and Wells Fargo Investment Institute. Data as of February 11, 2026. Chart shows the securities held by the Federal Reserve.
Secondaries continue to gain momentum
Secondary transactions in private capital — where investors buy and sell existing fund interests — continued to grow in 2025, based on recently released data. 1, 2 Global transaction volume exceeded $220 billion (see Chart 5), representing the largest annual total on record and an increase of over 40% from 2024. This growth appears to have been supported by ongoing demand for distribution and greater confidence among buyers and sellers.
The strength of the secondary market is also notable given that traditional exit routes, such as initial public offerings and mergers and acquisitions, began to show signs of recovery during 2025.3 This suggests that secondaries have been increasingly viewed as a strategic option for investors seeking to exit existing interests.
The range of secondary transactions also continued to expand.2 In 2025, both investors and fund managers actively initiated transactions, with each group accounting for roughly half of total market activity. At the same time, the buyer base broadened beyond dedicated secondaries funds to include institutional investors investing directly, as well as capital from evergreen vehicles.
Private Equity Secondaries remained the largest segment, representing about 70% of total transaction volume.2 However, secondary activity continued to expand into other private‑capital asset classes, including Private Debt, Private Infrastructure, and Venture Capital, reflecting broader adoption and a growing opportunity set.
Pricing in the secondary market remained relatively stable, generally near long‑term historical averages across strategies.2 We believe this environment has allowed transactions to occur while balancing the interests of both buyers and sellers.
Compared with primary private‑capital investments, secondaries may offer diversified exposure, improved visibility into underlying assets, and potentially attractive entry pricing. Investors should also consider risks such as limited liquidity, valuation uncertainty, and higher fees.
Given the growth in scale and diversification, we maintain a favorable view on secondaries strategies.
Chart 5. Secondary transaction volume has grown to over $220 billion
Sources: Pitchbook, Evercore, and Wells Fargo Investment Institute. Data as of December 31, 2025. See disclosure for secondary transaction data collection.
Alternative investments, such as hedge funds, private equity, private debt and private real estate funds are not appropriate for all investors and are only open to “accredited” or “qualified” investors within the meaning of U.S. securities laws.
1 Pitchbook, “US Market Insights,” February 6, 2026.
2 Evercore, “2025 Secondary Market Highlights,” January 19, 2026.
3 Pitchbook, “2025 Annual Global PE First Look,” January 6, 2026.
Cash Alternatives and Fixed Income
intentionally blank
intentionally blank
intentionally blank
| Most Unfavorable |
Unfavorable |
Neutral |
Favorable |
Most Favorable |
|
intentionally blank
|
- U.S. Long Term Taxable Fixed Income
- U.S. Short Term Taxable Fixed Income
|
- Cash Alternatives
- Developed Market Ex-U.S. Fixed Income
- Emerging Market Fixed Income
- High Yield Taxable Fixed Income
|
- U.S. Intermediate Term Taxable Fixed Income
|
intentionally blank
|
Equities
| Most Unfavorable |
Unfavorable |
Neutral |
Favorable |
Most Favorable |
|
intentionally blank
|
|
- Developed Market Ex-U.S. Equities
- Emerging Market Equities
|
- U.S. Large Cap Equities
- U.S. Mid Cap Equities
|
intentionally blank
|
Real Assets
| Most Unfavorable |
Unfavorable |
Neutral |
Favorable |
Most Favorable |
|
intentionally blank
|
intentionally blank
|
- Commodities
- Private Real Estate
|
|
intentionally blank
|
Alternative Investments**
| Most Unfavorable |
Unfavorable |
Neutral |
Favorable |
Most Favorable |
|
intentionally blank
|
intentionally blank
|
- Hedge Funds—Equity Hedge
- Hedge Funds—Macro
- Hedge Funds—Relative Value
- Private Equity
- Private Debt
|
|
intentionally blank
|
Source: Wells Fargo Investment Institute, February 17, 2026. Please see Wells Fargo Investment Institute's Asset Allocation Strategy Report for more detailed, investable ideas in each asset group.
*Tactical horizon is 6-18 months
**Alternative investments are not appropriate for all investors. They are speculative and involve a high degree of risk that is appropriate only for those investors who have the financial sophistication and expertise to evaluate the merits and risks of an investment in a fund and for which the fund does not represent a complete investment program. Please see end of report for important definitions and disclosures.


 Sources: FactSet and Wells Fargo Investment Institute. MMBtu = million British thermal units. U.S. natural gas prices represented by Henry Hub benchmark.
 Sources: Energy Information Administration (EIA) and Wells Fargo Investment Institute. Bcf/d = billion cubic feet per day. Dotted lines represent EIA forecast data as of February 10, 2026.
 Sources: FactSet and Wells Fargo Investment Institute. Weighted average yield data from 2009 through 2025. Volatility refers to the variability of dividend yield over time, which services as a proxy for income stability. Past performance is no guarantee of future results. An index is unmanaged and not available for direct investment.
 Sources: Bloomberg and Wells Fargo Investment Institute. Data as of February 11, 2026. Chart shows the securities held by the Federal Reserve.
 Sources: Pitchbook, Evercore, and Wells Fargo Investment Institute. Data as of December 31, 2025. See disclosure for secondary transaction data collection.