Forecasts are not guaranteed and based on certain assumptions and on views of market and economic conditions which are subject to change.
Each asset class has its own risk and return characteristics. The level of risk associated with a particular investment or asset class generally correlates with the level of return the investment or asset class might achieve. Stock markets, especially foreign markets, are volatile. Stock values may fluctuate in response to general economic and market conditions, the prospects of individual companies, and industry sectors. Foreign investing has additional risks including those associated with currency fluctuation, political and economic instability, and different accounting standards. These risks are heightened in emerging markets. Small- and mid-cap stocks are generally more volatile, subject to greater risks and are less liquid than large company stocks. Bonds are subject to market, interest rate, price, credit/default, liquidity, inflation and other risks. Prices tend to be inversely affected by changes in interest rates. High yield (junk) bonds have lower credit ratings and are subject to greater risk of default and greater principal risk. Although Treasuries are considered free from credit risk they are subject to other types of risks. These risks include interest rate risk, which may cause the underlying value of the bond to fluctuate. The commodities markets are considered speculative, carry substantial risks, and have experienced periods of extreme volatility. Investing in a volatile and uncertain commodities market may cause a portfolio to rapidly increase or decrease in value which may result in greater share price volatility. Investments in gold and gold-related investments tend to be more volatile than investments in traditional equity or debt securities. Such investments increase their vulnerability to international economic, monetary and political developments. They are also exposed to the risk of severe price fluctuations in the price of gold bullion. Investments in currencies involve certain risks, including credit risk, interest rate fluctuations, fluctuations in currency exchange rates, derivative investment risk and the effect of political and economic conditions. The use of currency transactions to seek to achieve gains in the portfolio could result in significant losses to the portfolio which exceeds the amount invested in the currency instruments. In addition, exchange rate movement between the U.S. dollar and foreign currencies may cause the value of the fund’s investments to decline.
Real estate has special risks including the possible illiquidity of underlying properties, credit risk, interest rate fluctuations and the impact of varied economic conditions.
Exchange-traded funds are subject to risks similar to those of stocks. Investment returns may fluctuate and are subject to market volatility, so that an investor’s shares, when redeemed, or sold, may be worth more or less than their original cost. ETFs seek investment results that, before expenses, generally correspond to the price and yield of a particular index. There is no assurance that the price and yield performance of the index can be fully matched.
Sector investing can be more volatile than investments that are broadly diversified over numerous sectors of the economy and will increase a portfolio’s vulnerability to any single economic, political, or regulatory development affecting the sector. This can result in greater price volatility. Communication Services companies are vulnerable to their products and services becoming outdated because of technological advancement and the innovation of competitors. Companies in the Communication Services sector may also be affected by rapid technology changes, pricing competition, large equipment upgrades, substantial capital requirements and government regulation and approval of products and services. In addition, companies within the industry may invest heavily in research and development which is not guaranteed to lead to successful implementation of the proposed product. Risks associated with the Consumer Discretionary sector include, among others, apparel price deflation due to low-cost entries, high inventory levels and pressure from e-commerce players, reduction in traditional advertising dollars, increasing household debt levels that could limit consumer appetite for discretionary purchases, declining consumer acceptance of new product introductions, and geopolitical uncertainty that could affect consumer sentiment. Consumer Staples industries can be significantly affected by competitive pricing particularly with respect to the growth of low-cost emerging market production, government regulation, the performance of the overall economy, interest rates, and consumer confidence. The Energy sector may be adversely affected by changes in worldwide energy prices, exploration, production spending, government regulation, and changes in exchange rates, depletion of natural resources, and risks that arise from extreme weather conditions. Investing in the Financial services companies will subject an investment to adverse economic or regulatory occurrences affecting the sector. Some of the risks associated with investment in the Health Care sector include competition on branded products, sales erosion due to cheaper alternatives, research and development risk, government regulations and government approval of products anticipated to enter the market. There is increased risk investing in the Industrials sector. The industries within the sector can be significantly affected by general market and economic conditions, competition, technological innovation, legislation and government regulations, among other things, all of which can significantly affect a portfolio’s performance. Materials industries can be significantly affected by the volatility of commodity prices, the exchange rate between foreign currency and the dollar, export/import concerns, worldwide competition, procurement and manufacturing and cost containment issues. Real estate investments have special risks, including possible illiquidity of the underlying properties, credit risk, interest rate fluctuations, and the impact of varied economic conditions. Risks associated with the Technology sector include increased competition from domestic and international companies, unexpected changes in demand, regulatory actions, technical problems with key products, and the departure of key members of management. Technology and Internet-related stocks, especially smaller, less-seasoned companies, tend to be more volatile than the overall market. Utilities are sensitive to changes in interest rates, and the securities within the sector can be volatile and may underperform in a slow economy.
Alternative investments, such as hedge funds, private equity/private debt and private real estate funds, are speculative and involve a high degree of risk that is appropriate only for those investors who have the financial sophistication and expertise to evaluate the merits and risks of an investment in a fund and for which the fund does not represent a complete investment program. They entail significant risks that can include losses due to leveraging or other speculative investment practices, lack of liquidity, volatility of returns, restrictions on transferring interests in a fund, potential lack of diversification, absence and/or delay of information regarding valuations and pricing, complex tax structures and delays in tax reporting, less regulation and higher fees than mutual funds. Hedge fund, private equity, private debt and private real estate fund investing involves other material risks including capital loss and the loss of the entire amount invested. A fund's offering documents should be carefully reviewed prior to investing.
Hedge fund strategies, such as Equity Hedge, Event Driven, Macro and Relative Value, may expose investors to the risks associated with the use of short selling, leverage, derivatives and arbitrage methodologies. Short sales involve leverage and theoretically unlimited loss potential since the market price of securities sold short may continuously increase. The use of leverage in a portfolio varies by strategy. Leverage can significantly increase return potential but create greater risk of loss. Derivatives generally have implied leverage which can magnify volatility and may entail other risks such as market, interest rate, credit, counterparty and management risks. Arbitrage strategies expose a fund to the risk that the anticipated arbitrage opportunities will not develop as anticipated, resulting in potentially reduced returns or losses to the fund.
An index is unmanaged and not available for direct investment.
Bloomberg Commodity Index is comprised of 22 exchange-traded futures on physical commodities and represents 20 commodities weighted to account for economic significance and market liquidity.
CBOE Volatility Index (VIX) is a key measure of market expectations of near-term volatility conveyed by S&P 500 stock index option prices.
S&P 500 Index is a market capitalization-weighted index composed of 500 widely held common stocks that is generally considered representative of the US stock market.
Global Investment Strategy (GIS) is a division of Wells Fargo Investment Institute, Inc. (WFII). WFII is a registered investment adviser and wholly owned subsidiary of Wells Fargo Bank, N.A., a bank affiliate of Wells Fargo & Company.
The information in this report was prepared by Global Investment Strategy. Opinions represent GIS’ opinion as of the date of this report and are for general information purposes only and are not intended to predict or guarantee the future performance of any individual security, market sector or the markets generally. GIS does not undertake to advise you of any change in its opinions or the information contained in this report. Wells Fargo & Company affiliates may issue reports or have opinions that are inconsistent with, and reach different conclusions from, this report.
The information contained herein constitutes general information and is not directed to, designed for, or individually tailored to, any particular investor or potential investor. This report is not intended to be a client-specific suitability or best interest analysis or recommendation, an offer to participate in any investment, or a recommendation to buy, hold or sell securities. Do not use this report as the sole basis for investment decisions. Do not select an asset class or investment product based on performance alone. Consider all relevant information, including your existing portfolio, investment objectives, risk tolerance, liquidity needs and investment time horizon. The material contained herein has been prepared from sources and data we believe to be reliable but we make no guarantee to its accuracy or completeness.
Wells Fargo Advisors is registered with the U.S. Securities and Exchange Commission and the Financial Industry Regulatory Authority, but is not licensed or registered with any financial services regulatory authority outside of the U.S. Non-U.S. residents who maintain U.S.-based financial services account(s) with Wells Fargo Advisors may not be afforded certain protections conferred by legislation and regulations in their country of residence in respect of any investments, investment transactions or communications made with Wells Fargo Advisors.
Wells Fargo Advisors is a trade name used by Wells Fargo Clearing Services, LLC and Wells Fargo Advisors Financial Network, LLC, Members SIPC, separate registered broker-dealers and non-bank affiliates of Wells Fargo & Company.


 Sources: The Federal Reserve and Wells Fargo Investment Institute. Data as of December 31, 2024.
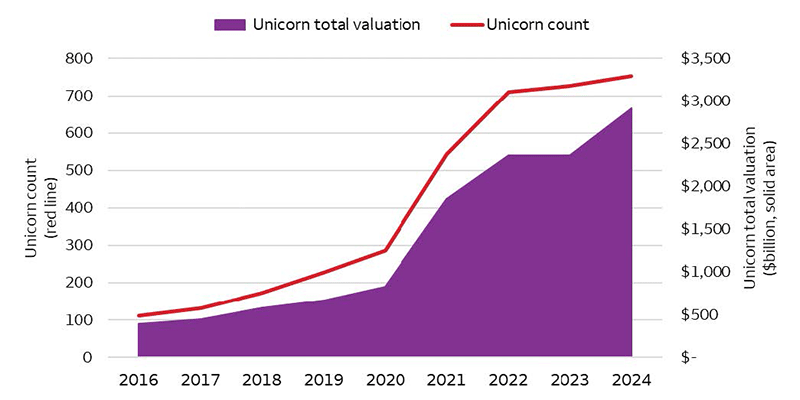 Sources: Pitchbook and Wells Fargo Investment Institute. Data as of December 31, 2024.
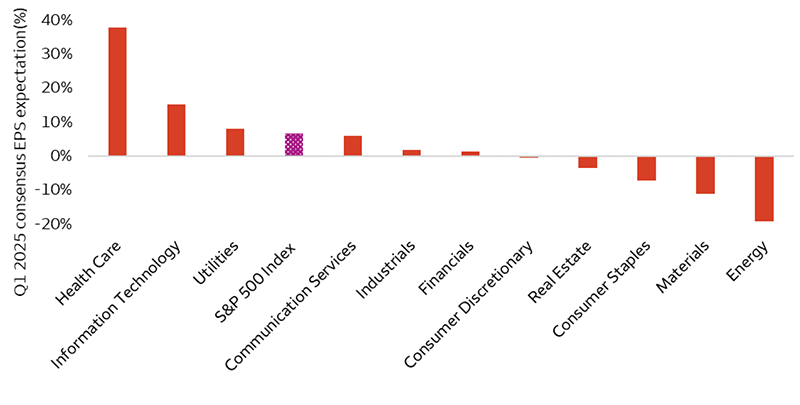 Sources: Bloomberg and Wells Fargo Investment Institute. Earnings-per-share (EPS) growth measures the earnings growth of the S&P 500 Index and each of its sectors, as of April 14, 2025, versus first-quarter 2024 EPS.
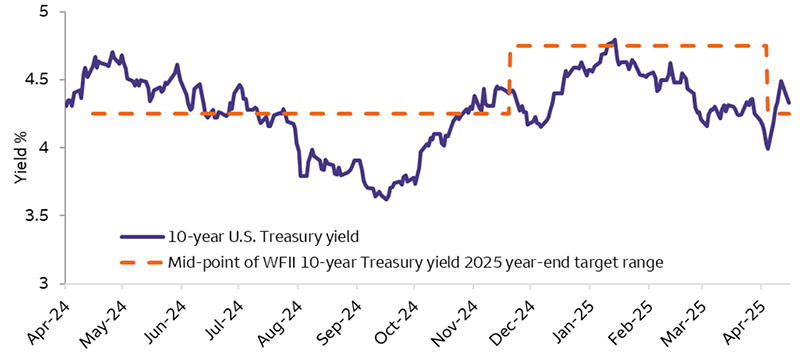 Sources: Bloomberg and Wells Fargo Investment Institute as of April 15, 2025. Past performance is no guarantee of future results. Forecasts and targets are based on certain assumptions and on views of market and economic conditions which are subject to change.
 Sources: World Gold Council, Bloomberg, and Wells Fargo Investment Institute. Monthly data is from January 2022 – March 2025. Past performance is no guarantee of future results.